The tight capacity and high rates caused by the pandemic have had severe repercussions for the air freight industry, and there’s more turbulence ahead.
Balika Sonthalia is a senior partner and leads global management in the Strategic Operations practice of Kearney, a global management consulting firm, specializing in procurement, supply chain, and logistics.
This story first appeared in the Special Issue 2021 of CSCMP’s Supply Chain Quarterly, a journal of thought leadership for the supply chain management profession and a sister publication to AGiLE Business Media’s DC Velocity.
Covid-19 rattled the global air freight industry as much as any other logistics sector last year, causing constrained capacity, service disruptions, and rising costs. While carriers and intermediaries have deployed creative stopgap solutions and shippers have demonstrated flexibility, the basic math of supply and demand remains daunting.
Overall air freight volumes were down year-on-year for 2020 due to lockdowns early in the year. According to International Air Transport Association (IATA), cargo ton kilometers (CTKs) fell by nearly 11%. In spite of the drop in overall demand, however, rates skyrocketed, as capacity saw an even steeper net decline.
Pre-Covid, roughly 60% of global air cargo had been carried in the bellies of passenger planes. This fell to about a third by year-end 2020 as belly capacity from passenger flights dropped by 53% due to flight schedule reductions and cancellations, according to IATA figures.1 Airlines have responded by increasing both the size of their freighter fleet and daily utilization, but even those efforts were not enough, and overall available cargo-ton kilometers (ACTK) saw a net reduction of 23% for the year.
As a result, freight rates for the remaining capacity surged. The Drewry East-West average air freight rates for April and May 2020 were more than double the consistent averages seen in past years (see Exhibit 1). While rates have moderated slightly since, they remain historically high. The average spot rate from Shanghai to North America, for example, peaked at $12.78 per kilogram in May 2020, then fell by more than half to $5.70 in late March 2021—still about 70% above the March 2019 rate of $3.30.
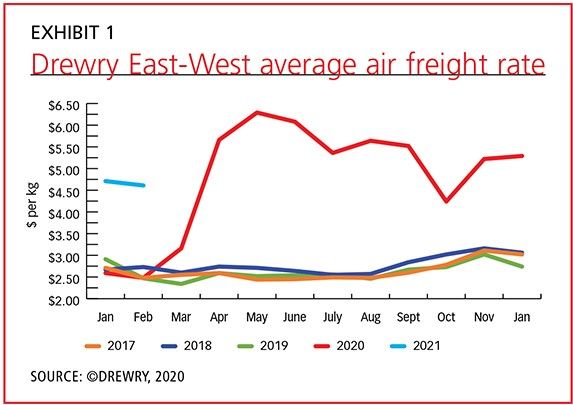
In response to the tight capacity and sky-high rates, some freight forwarders and shippers of high-value, time-sensitive freight chartered aircraft last year. Apple, for example, chartered more than 200 private jets to ship devices in 2020, a single-year record for the company. At the same time, it shipped less urgent AirPods and other peripherals by sea for the first time and increased its use of ocean freight for older iPhone models to free up air freight capacity for the iPhone 12. Another technology company that chartered planes resold excess capacity to mitigate costs. The trend toward charters does not appear to be dissipating, as some freight forwarders are suggesting that they will continue to offer them as part of their permanent mix of service offerings going forward.
FACTORS BOOSTING DEMAND
This response is not surprising given that in the second half of 2020 and the first half of 2021, demand for air cargo has been strong and has outpaced the return of capacity. The global surge in e-commerce as brick-and-mortar businesses closed and people sheltered in place meant that less freight was being shipped as palletized loads and more was being sent as parcels with time-definite deliveries. As a result, shippers shifted a significant portion of their cargo away from full truckloads and toward air and less-than-full truckloads. At the same time, the need to quickly position medicines, hospital supplies, and medical equipment further boosted air freight demand. Meanwhile shippers of perishable produce, just-in-time parts, and other urgent freight switched to air from ocean to avoid container shortages, unreliable ocean shipping schedules, and soaring ocean shipping rates.
Pandemic repercussions will continue to affect air freight demand and capacity for the remainder of 2021. Vaccines initially took much of the available air cargo capacity, crowding out other time-sensitive freight. While new vaccine approvals and added production sites have already helped disperse demand in the U.S., the extent and timelines for vaccine distribution to the rest of the world remain uncertain. At the same time, air cargo will remain a critical option for replenishment, as companies look to mitigate sudden shortages and restart disrupted supply chains.
Air freight demand and capacity could also be affected by an increase in global trade. North American air cargo capacity declined less at the height of the pandemic, and recovered faster, than elsewhere in the world. But most of the growth in air cargo demand has occurred elsewhere, notably within Asia, suggesting that even as capacity recovers worldwide, markets will remain tight.
However, the extent that pent-up global demand will affect air freight in 2021 is currently unclear due to trade uncertainty. U.S.-China relations are likely to remain static for now, as strategic and competitive differences offset broader economic interdependence. However, the U.S. could rejoin the Trans-Pacific Partnership or otherwise accelerate the ongoing migration of trade from China to lower-cost countries in Asia such as Vietnam and Indonesia. If this occurs, air freight will be critical to mitigating longer ocean transit times and infrastructure constraints in those markets.
Meanwhile, Brexit-related customs clearance delays, plus global ocean equipment imbalances and port congestion, have dramatically increased air cargo and charter demand in the United Kingdom and the European Union in early 2021. And one-off emergency situations—such as when the grounded containership Ever Given blocked the Suez Canal for six days last March—have also boosted demand for air freight, as shippers seek to work around congestion delays and meet priority delivery commitments.
PIVOT TO CARGO?
At the same time as it has been experiencing demand volatility, the industry has also seen a significant shift in the dynamics of passenger versus nonpassenger cargo. Case in point: Los Angeles area airports saw a 67% plunge in passenger traffic, versus a 9.2% increase in cargo tons moved during 2020. Given freight capacity constraints and predictions that passenger traffic is unlikely to return to pre-pandemic levels until 2024, this trend is expected to have staying power.
Many airlines are not only expanding their all-cargo fleet size and schedules but also converting passenger planes to all-cargo operations. Through September 2020, nearly 200 global airlines converted some 2,500 passenger jets, representing about 10% of the global fleet.
Short-term conversions can take two forms: fastening cargo onto seats and covering it with netting or removing the seats entirely. Permanent conversion involves gutting cabins, modifying cockpits, sealing emergency exits, and installing cargo hatches—a process that costs millions of dollars and takes three to four months. Boeing expects that two-thirds of the 2,430 freighters it will deliver by 2039 will be passenger-to-freighter conversions.
Such a pivot extends beyond retrofitting equipment to rethinking routes, schedules, and airport cargo handling operations, including the handling of hazardous and other specialized cargoes. It also entails changes in corporate culture and raises business model considerations regarding relationships with shippers and forwarders.2
LESSONS LEARNED
More than a year into the pandemic, carriers have gained valuable insights about how and when to convert planes to freighters and are refining their relationships with large freight forwarders. For example, Ceva Logistics purchases dozens of flights every week to guarantee space—an option likely not available to smaller forwarders. Indeed, we may see more forwarder consolidation in the future as others try to achieve this level of scale, meaning carriers will find themselves dealing with fewer forwarder customers with more clout.
On the shipper side, lessons learned center on the relative permanence of recent market shifts. Meaningful capacity growth will not return until passengers do, suggesting sustained dependency on all-cargo capacity and charters, as well as flexibility among modes. Laboratory products distributor Thomas Scientific, for example, continues to benefit from a multimodal strategy including motor, ocean, and air adopted last year as demand surged for Covid test kits.
Shippers have also learned the benefits of adopting technology solutions. Most made a faster-than-expected transition to digital air freight marketplaces, which offer convenient e-booking with space and rate transparency for as much as 15% of global airfreight capacity. For example, the WebCargo booking platform, which claims to have 22,000 users, reported a dip in revenue as Covid peaked in February-March 2020, but quickly recovered by June. Similarly, transport company Kuehne+Nagel credits digitalization and automation in its booking, invoicing, and documentation processes for an increase in its air cargo volumes—despite capacity limitations.
With shippers still learning from the pandemic and working to restructure their supply chains to add resilience, the potential impact on air cargo has yet to fully play out. It is still unclear whether steps such as multimodal diversification and changes to contingency planning and safety stocks will create new business opportunities for air cargo carriers or if they will just erode volume. The “new normal” is still, for now, a work in progress.
Notes:
1. IATA, Air Cargo Market Analysis: Robust end to 2020 for air cargo (December 2020)
Most of the apparel sold in North America is manufactured in Asia, meaning the finished goods travel long distances to reach end markets, with all the associated greenhouse gas emissions. On top of that, apparel manufacturing itself requires a significant amount of energy, water, and raw materials like cotton. Overall, the production of apparel is responsible for about 2% of the world’s total greenhouse gas emissions, according to a report titled
Taking Stock of Progress Against the Roadmap to Net Zeroby the Apparel Impact Institute. Founded in 2017, the Apparel Impact Institute is an organization dedicated to identifying, funding, and then scaling solutions aimed at reducing the carbon emissions and other environmental impacts of the apparel and textile industries.
The author of this annual study is researcher and consultant Michael Sadowski. He wrote the first report in 2021 as well as the latest edition, which was released earlier this year. Sadowski, who is also executive director of the environmental nonprofit
The Circulate Initiative, recently joined DC Velocity Group Editorial Director David Maloney on an episode of the “Logistics Matters” podcast to discuss the key findings of the research, what companies are doing to reduce emissions, and the progress they’ve made since the first report was issued.
A: While companies in the apparel industry can set their own sustainability targets, we realized there was a need to give them a blueprint for actually reducing emissions. And so, we produced the first report back in 2021, where we laid out the emissions from the sector, based on the best estimates [we could make using] data from various sources. It gives companies and the sector a blueprint for what we collectively need to do to drive toward the ambitious reduction [target] of staying within a 1.5 degrees Celsius pathway. That was the first report, and then we committed to refresh the analysis on an annual basis. The second report was published last year, and the third report came out in May of this year.
Q: What were some of the key findings of your research?
A: We found that about half of the emissions in the sector come from Tier Two, which is essentially textile production. That includes the knitting, weaving, dyeing, and finishing of fabric, which together account for over half of the total emissions. That was a really important finding, and it allows us to focus our attention on the interventions that can drive those emissions down.
Raw material production accounts for another quarter of emissions. That includes cotton farming, extracting gas and oil from the ground to make synthetics, and things like that. So we now have a really keen understanding of the source of our industry’s emissions.
Q: Your report mentions that the apparel industry is responsible for about 2% of global emissions. Is that an accurate statistic?
A: That’s our best estimate of the total emissions [generated by] the apparel sector. Some other reports on the industry have apparel at up to 8% of global emissions. And there is a commonly misquoted number in the media that it’s 10%. From my perspective, I think the best estimate is somewhere under 2%.
We know that globally, humankind needs to reduce emissions by roughly half by 2030 and reach net zero by 2050 to hit international goals. [Reaching that target will require the involvement of] every facet of the global economy and every aspect of the apparel sector—transportation, material production, manufacturing, cotton farming. Through our work and that of others, I think the apparel sector understands what has to happen. We have highlighted examples of how companies are taking action to reduce emissions in the roadmap reports.
Q: What are some of those actions the industry can take to reduce emissions?
A: I think one of the positive developments since we wrote the first report is that we’re seeing companies really focus on the most impactful areas. We see companies diving deep on thermal energy, for example. With respect to Tier Two, we [focus] a lot of attention on things like ocean freight versus air. There’s a rule of thumb I’ve heard that indicates air freight is about 10 times the cost [of ocean] and also produces 10 times more greenhouse gas emissions.
There is money available to invest in sustainability efforts. It’s really exciting to see the funding that’s coming through for AI [artificial intelligence] and to see that individual companies, such as H&M and Lululemon, are investing in real solutions in their supply chains. I think a lot of concrete actions are being taken.
And yet we know that reducing emissions by half on an absolute basis by 2030 is a monumental undertaking. So I don’t want to be overly optimistic, because I think we have a lot of work to do. But I do think we’ve got some amazing progress happening.
Q: You mentioned several companies that are starting to address their emissions. Is that a result of their being more aware of the emissions they generate? Have you seen progress made since the first report came out in 2021?
A: Yes. When we published the first roadmap back in 2021, our statistics showed that only about 12 companies had met the criteria [for setting] science-based targets. In 2024, the number of apparel, textile, and footwear companies that have set targets or have commitments to set targets is close to 500. It’s an enormous increase. I think they see the urgency more than other sectors do.
We have companies that have been working at sustainability for quite a long time. I think the apparel sector has developed a keen understanding of the impacts of climate change. You can see the impacts of flooding, drought, heat, and other things happening in places like Bangladesh and Pakistan and India. If you’re a brand or a manufacturer and you have operations and supply chains in these places, I think you understand what the future will look like if we don’t significantly reduce emissions.
Q: There are different categories of emission levels, depending on the role within the supply chain. Scope 1 are “direct” emissions under the reporting company’s control. For apparel, this might be the production of raw materials or the manufacturing of the finished product. Scope 2 covers “indirect” emissions from purchased energy, such as electricity used in these processes. Scope 3 emissions are harder to track, as they include emissions from supply chain partners both upstream and downstream.
Now companies are finding there are legislative efforts around the world that could soon require them to track and report on all these emissions, including emissions produced by their partners’ supply chains. Does this mean that companies now need to be more aware of not only what greenhouse gas emissions they produce, but also what their partners produce?
A: That’s right. Just to put this into context, if you’re a brand like an Adidas or a Gap, you still have to consider the Scope 3 emissions. In particular, there are the so-called “purchased goods and services,” which refers to all of the embedded emissions in your products, from farming cotton to knitting yarn to making fabric. Those “purchased goods and services” generally account for well above 80% of the total emissions associated with a product. It’s by far the most significant portion of your emissions.
Leading companies have begun measuring and taking action on Scope 3 emissions because of regulatory developments in Europe and, to some extent now, in California. I do think this is just a further tailwind for the work that the industry is doing.
I also think it will definitely ratchet up the quality requirements of Scope 3 data, which is not yet where we’d all like it to be. Companies are working to improve that data, but I think the regulatory push will make the quality side increasingly important.
Q: Overall, do you think the work being done by the Apparel Impact Institute will help reduce greenhouse gas emissions within the industry?
A: When we started this back in 2020, we were at a place where companies were setting targets and knew their intended destination, but what they needed was a blueprint for how to get there. And so, the roadmap [provided] this blueprint and identified six key things that the sector needed to do—from using more sustainable materials to deploying renewable electricity in the supply chain.
Decarbonizing any sector, whether it’s transportation, chemicals, or automotive, requires investment. The Apparel Impact Institute is bringing collective investment, which is so critical. I’m really optimistic about what they’re doing. They have taken a data-driven, evidence-based approach, so they know where the emissions are and they know what the needed interventions are. And they’ve got the industry behind them in doing that.
The global air cargo market’s hot summer of double-digit demand growth continued in August with average spot rates showing their largest year-on-year jump with a 24% increase, according to the latest weekly analysis by Xeneta.
Xeneta cited two reasons to explain the increase. First, Global average air cargo spot rates reached $2.68 per kg in August due to continuing supply and demand imbalance. That came as August's global cargo supply grew at its slowest ratio in 2024 to-date at 2% year-on-year, while global cargo demand continued its double-digit growth, rising +11%.
The second reason for higher rates was an ocean-to-air shift in freight volumes due to Red Sea disruptions and e-commerce demand.
Those factors could soon be amplified as e-commerce shows continued strong growth approaching the hotly anticipated winter peak season. E-commerce and low-value goods exports from China in the first seven months of 2024 increased 30% year-on-year, including shipments to Europe and the US rising 38% and 30% growth respectively, Xeneta said.
“Typically, air cargo market performance in August tends to follow the July trend. But another month of double-digit demand growth and the strongest rate growths of the year means there was definitely no summer slack season in 2024,” Niall van de Wouw, Xeneta’s chief airfreight officer, said in a release.
“Rates we saw bottoming out in late July started picking up again in mid-August. This is too short a period to call a season. This has been a busy summer, and now we’re at the threshold of Q4, it will be interesting to see what will happen and if all the anticipation of a red-hot peak season materializes,” van de Wouw said.
The report cites data showing that there are approximately 1.7 million workers missing from the post-pandemic workforce and that 38% of small firms are unable to fill open positions. At the same time, the “skills gap” in the workforce is accelerating as automation and AI create significant shifts in how work is performed.
That information comes from the “2024 Labor Day Report” released by Littler’s Workplace Policy Institute (WPI), the firm’s government relations and public policy arm.
“We continue to see a labor shortage and an urgent need to upskill the current workforce to adapt to the new world of work,” said Michael Lotito, Littler shareholder and co-chair of WPI. “As corporate executives and business leaders look to the future, they are focused on realizing the many benefits of AI to streamline operations and guide strategic decision-making, while cultivating a talent pipeline that can support this growth.”
But while the need is clear, solutions may be complicated by public policy changes such as the upcoming U.S. general election and the proliferation of employment-related legislation at the state and local levels amid Congressional gridlock.
“We are heading into a contentious election that has already proven to be unpredictable and is poised to create even more uncertainty for employers, no matter the outcome,” Shannon Meade, WPI’s executive director, said in a release. “At the same time, the growing patchwork of state and local requirements across the U.S. is exacerbating compliance challenges for companies. That, coupled with looming changes following several Supreme Court decisions that have the potential to upend rulemaking, gives C-suite executives much to contend with in planning their workforce-related strategies.”
Stax Engineering, the venture-backed startup that provides smokestack emissions reduction services for maritime ships, will service all vessels from Toyota Motor North America Inc. visiting the Toyota Berth at the Port of Long Beach, according to a new five-year deal announced today.
Beginning in 2025 to coincide with new California Air Resources Board (CARB) standards, STAX will become the first and only emissions control provider to service roll-on/roll-off (ro-ros) vessels in the state of California, the company said.
Stax has rapidly grown since its launch in the first quarter of this year, supported in part by a $40 million funding round from investors, announced in July. It now holds exclusive service agreements at California ports including Los Angeles, Long Beach, Hueneme, Benicia, Richmond, and Oakland. The firm has also partnered with individual companies like NYK Line, Hyundai GLOVIS, Equilon Enterprises LLC d/b/a Shell Oil Products US (Shell), and now Toyota.
Stax says it offers an alternative to shore power with land- and barge-based, mobile emissions capture and control technology for shipping terminal and fleet operators without the need for retrofits.
In the case of this latest deal, the Toyota Long Beach Vehicle Distribution Center imports about 200,000 vehicles each year on ro-ro vessels. Stax will keep those ships green with its flexible exhaust capture system, which attaches to all vessel classes without modification to remove 99% of emitted particulate matter (PM) and 95% of emitted oxides of nitrogen (NOx). Over the lifetime of this new agreement with Toyota, Stax estimated the service will account for approximately 3,700 hours and more than 47 tons of emissions controlled.
“We set out to provide an emissions capture and control solution that was reliable, easily accessible, and cost-effective. As we begin to service Toyota, we’re confident that we can meet the needs of the full breadth of the maritime industry, furthering our impact on the local air quality, public health, and environment,” Mike Walker, CEO of Stax, said in a release. “Continuing to establish strong partnerships will help build momentum for and trust in our technology as we expand beyond the state of California.”
That result showed that driver wages across the industry continue to increase post-pandemic, despite a challenging freight market for motor carriers. The data comes from ATA’s “Driver Compensation Study,” which asked 120 fleets, more than 150,000 employee drivers, and 14,000 independent contractors about their wage and benefit information.
Drilling into specific categories, linehaul less-than-truckload (LTL) drivers earned a median annual amount of $94,525 in 2023, while local LTL drivers earned a median of $80,680. The median annual compensation for drivers at private carriers has risen 12% since 2021, reaching $95,114 in 2023. And leased-on independent contractors for truckload carriers were paid an annual median amount of $186,016 in 2023.
The results also showed how the demographics of the industry are changing, as carriers offered smaller referral and fewer sign-on bonuses for new drivers in 2023 compared to 2021 but more frequently offered tenure bonuses to their current drivers and with a greater median value.
"While our last study, conducted in 2021, illustrated how drivers benefitted from the strongest freight environment in a generation, this latest report shows professional drivers' earnings are still rising—even in a weaker freight economy," ATA Chief Economist Bob Costello said in a release. "By offering greater tenure bonuses to their current driver force, many fleets appear to be shifting their workforce priorities from recruitment to retention."