Skip to content
Search AI Powered

Latest Stories

newsworthy

Logistics sector growth holds steady in September

Industry growth continues its slow pace, but activity is down considerably from a year ago, according to latest Logistics Manager's Index.

Economic activity in the logistics sector continued its slow pace of growth in September, according to the latest Logistics Manager's Index (LMI) report, released this week.

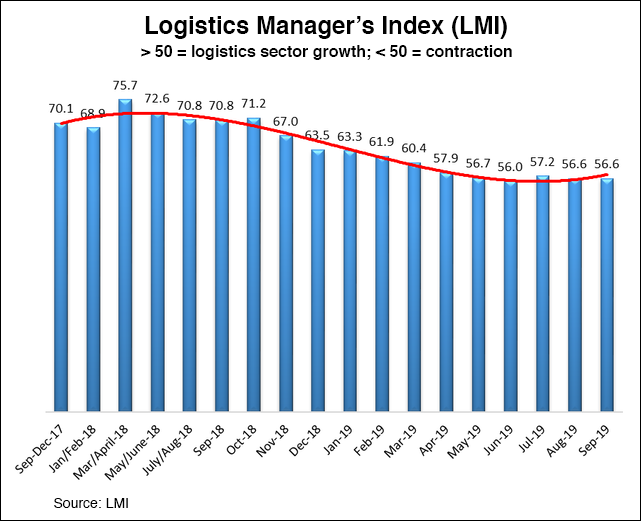
The LMI registered 56.6 in September, which was even with August, but down considerably from its September 2018 reading of 70.8. An LMI reading above 50 indicates growth in the logistics sector; a reading below 50 indicates contraction. LMI researchers pointed to marginal growth in the transportation prices index and growth in warehousing capacity during the month, noting that overall industry conditions call for continued slow growth ahead.


Logistics Manager's Index (LMI) September 2019


The LMI's transportation prices index registered 50.6 in September, up from August's reading of 48.9. Despite the increase, LMI researchers said the change indicates that transportation prices are remaining steady, overall. Looking ahead, however, they said logistics managers surveyed for the September report expect transportation prices to increase over the next 12 months. 

The research also showed that warehousing capacity increased for the first time since June, registering 54.4 compared to last month's reading of 50. Researchers said the increase could indicate expansion in preparation for the busy holiday season.

Although the overall LMI held steady at 56.6, it marks the second lowest score in the history of the index and continues a slowing trend that began in April, when the index dipped below 60 for the first time. 

"The lowest seven scores in the history of the index have all occurred within the last seven months," LMI researchers said in a statement announcing the monthly results. "Every score has been above 50, which indicates growth in the logistics industry, [but] the growth has just been very slow."

The LMI tracks logistics industry growth overall and across eight areas: inventory levels and costs; warehousing capacity, utilization, and prices; and transportation capacity, utilization, and prices. The report is released each month by researchers from Arizona State University, Colorado State University, Rochester Institute of Technology, Rutgers University, and the University of Nevada, Reno, in conjunction with the Council of Supply Chain Management Professionals (CSCMP).

The Latest

More Stories

Image of earth made of sculpted paper, surrounded by trees and green

Creating a sustainability roadmap for the apparel industry: interview with Michael Sadowski

Michael Sadowski
Michael Sadowski

Most of the apparel sold in North America is manufactured in Asia, meaning the finished goods travel long distances to reach end markets, with all the associated greenhouse gas emissions. On top of that, apparel manufacturing itself requires a significant amount of energy, water, and raw materials like cotton. Overall, the production of apparel is responsible for about 2% of the world’s total greenhouse gas emissions, according to a report titled

Taking Stock of Progress Against the Roadmap to Net Zeroby the Apparel Impact Institute. Founded in 2017, the Apparel Impact Institute is an organization dedicated to identifying, funding, and then scaling solutions aimed at reducing the carbon emissions and other environmental impacts of the apparel and textile industries.

Keep ReadingShow less

Featured

xeneta air-freight.jpeg

Air cargo carriers enjoy 24% rise in average spot rates

The global air cargo market’s hot summer of double-digit demand growth continued in August with average spot rates showing their largest year-on-year jump with a 24% increase, according to the latest weekly analysis by Xeneta.

Xeneta cited two reasons to explain the increase. First, Global average air cargo spot rates reached $2.68 per kg in August due to continuing supply and demand imbalance. That came as August's global cargo supply grew at its slowest ratio in 2024 to-date at 2% year-on-year, while global cargo demand continued its double-digit growth, rising +11%.

Keep ReadingShow less
littler Screenshot 2024-09-04 at 2.59.02 PM.png

Congressional gridlock and election outcomes complicate search for labor

Worker shortages remain a persistent challenge for U.S. employers, even as labor force participation for prime-age workers continues to increase, according to an industry report from labor law firm Littler Mendelson P.C.

The report cites data showing that there are approximately 1.7 million workers missing from the post-pandemic workforce and that 38% of small firms are unable to fill open positions. At the same time, the “skills gap” in the workforce is accelerating as automation and AI create significant shifts in how work is performed.

Keep ReadingShow less
stax PR_13August2024-NEW.jpg

Toyota picks vendor to control smokestack emissions from its ro-ro ships

Stax Engineering, the venture-backed startup that provides smokestack emissions reduction services for maritime ships, will service all vessels from Toyota Motor North America Inc. visiting the Toyota Berth at the Port of Long Beach, according to a new five-year deal announced today.

Beginning in 2025 to coincide with new California Air Resources Board (CARB) standards, STAX will become the first and only emissions control provider to service roll-on/roll-off (ro-ros) vessels in the state of California, the company said.

Keep ReadingShow less
trucker premium_photo-1670650045209-54756fb80f7f.jpeg

ATA survey: Truckload drivers earn median salary of $76,420

Truckload drivers in the U.S. earned a median annual amount of $76,420 in 2023, posting an increase of 10% over the last survey, done two years ago, according to an industry survey from the fleet owners’ trade group American Trucking Associations (ATA).

That result showed that driver wages across the industry continue to increase post-pandemic, despite a challenging freight market for motor carriers. The data comes from ATA’s “Driver Compensation Study,” which asked 120 fleets, more than 150,000 employee drivers, and 14,000 independent contractors about their wage and benefit information.

Keep ReadingShow less