Footwear and accessories retailer Journeys is poised to accommodate future growth thanks to a distribution center upgrade that includes an efficiency-enhancing warehouse execution system.
Victoria Kickham started her career as a newspaper reporter in the Boston area before moving into B2B journalism. She has covered manufacturing, distribution and supply chain issues for a variety of publications in the industrial and electronics sectors, and now writes about everything from forklift batteries to omnichannel business trends for DC Velocity.
Omnichannel business trends continue to push the boundaries of traditional retail operations, sending companies racing toward technology solutions that not only expedite the fulfillment and delivery processes, but can also set the stage to accommodate long-term growth. Specialty retailer Journeys recently expanded its Lebanon, Tenn., warehouse and distribution center with those very goals in mind and today is reaping the benefits of a streamlined operation that can efficiently handle its fast-growing order volume.
As Journeys' leaders have described it, the Tennessee warehouse and DC needed an upgrade that would do more than just automate distribution center processes; it needed one that would provide the flexibility to deal with changing demands on both the traditional retail and e-commerce sides of the business while offering scalability to accommodate future growth. The Journeys team embarked on a facility expansion and upgrade that would include additional storage space, increased automation—especially for picking processes—and a warehouse execution system (WES) that would tie everything together by creating a more efficient flow of orders through the building. A software system that helps highly automated DCs connect disparate systems and functions in one platform, the WES is helping Journeys better manage its e-commerce orders for a more successful omnichannel operation.
"For fast-growing omnichannel retailers, it's hard to predict trends and which way revenue will increase for [store-based] retail, e-commerce, or both," says Jeremy Davidson, vice president of sales for supply chain consulting firm Fortna, which partnered with Journeys on the upgrade and expansion. "[Journeys] wanted to have the ability to turn up [traditional] retail on demand or e-commerce or both. They wanted to be able to route orders to meet service [goals] and facilitate their growth."
BURSTING AT THE SEAMS
In 2002, the Lebanon warehouse and DC served 800 retail stores, processing 17 million units annually. Today, the facility serves 1,500 retail stores, processing more than 30 million units a year.
Journeys has grown considerably in the last 17 years, especially as omnichannel business trends have taken hold. In 2002, the Lebanon warehouse and DC served 800 retail stores, processing 17 million units annually. Today, the facility serves 1,500 retail stores, processing more than 30 million units annually, with a growing e-commerce business. Such explosive growth was difficult enough for the footwear, clothing, and accessories company to keep up with during regular business times; peak seasonal demands, such as the back-to-school and Christmas holiday seasons, were even more challenging. Like many retailers, the company struggled to get orders out the same day they were received during peak periods, constrained by a system designed to handle considerably less volume.
At the same time, Journeys faced growing competition for workers in the local area. As its business grew, Journeys, like so many other retailers, found itself under pressure to attract and retain the best employees. Expanding and upgrading the Lebanon warehouse and DC was a necessary step in addressing both the capacity and talent challenges.
"[Journeys] wanted to be more competitive in operating costs and cycle time to market, but they also wanted to become an employer of choice in their geography," Davidson explains. "They wanted to address how associates engage [with] the site as well as the technology they integrate with."
The retailer decided to partner with Fortna, which had designed and implemented Journeys' existing warehouse system in 2002, for a facility upgrade and expansion that would meet the company's growth expectations over the next 10 years. The project, which was completed in 2018, added 200,000 square feet of space, increased automation throughout the warehouse, and completely revamped the workspace, including office space and break facilities, to create a more welcoming and comfortable environment for workers.
PUTTING NEW PROCESSES IN PLACE
Journeys also made big changes to its fulfillment process, automating manual processes and upgrading existing automation to handle a larger workload.
Working with Fortna, Journeys redesigned its receiving area to include 21 additional dock doors and the ability to accommodate automation in receiving in the years ahead. The changes allow Journeys to cross-dock up to 20 percent of receipts as well as pre-pack cartons, speeding throughput. Additional storage capacity throughout the building—in the form of various types of racking—allows workers to do more floor-level picking, speeding fulfillment.
Journeys also made big changes to its fulfillment process, automating manual processes and upgrading existing automation to handle a larger workload. One of the biggest changes was that Journeys went from a discrete picking system to a batch picking method for its e-commerce orders; multiline orders are now funneled to a put-to-light wall, where they are then individually sorted into the final order. This streamlines fulfillment and reduces worker travel time throughout the facility.
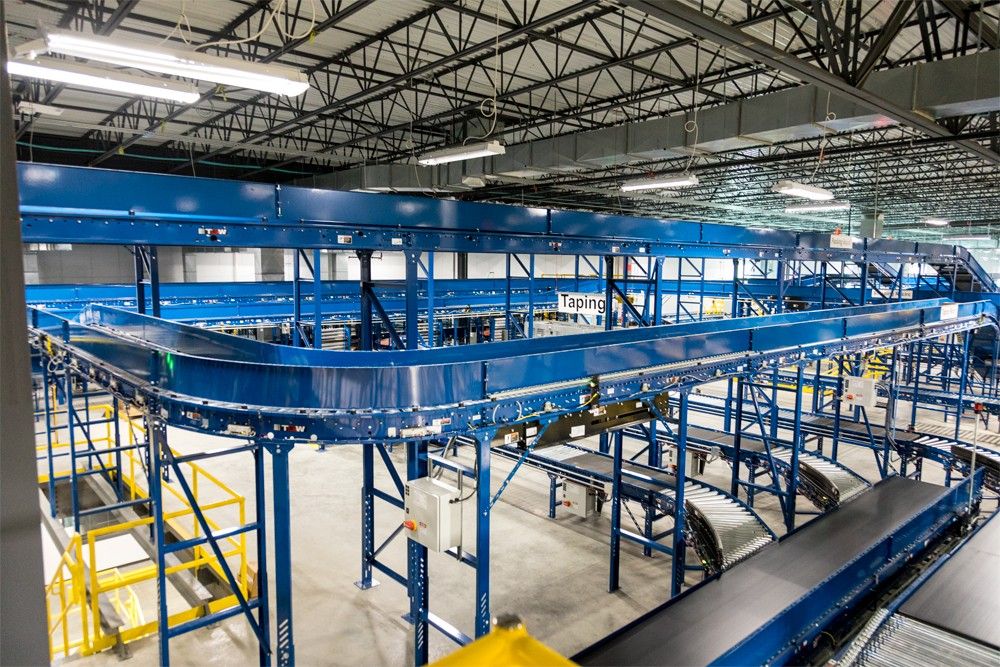
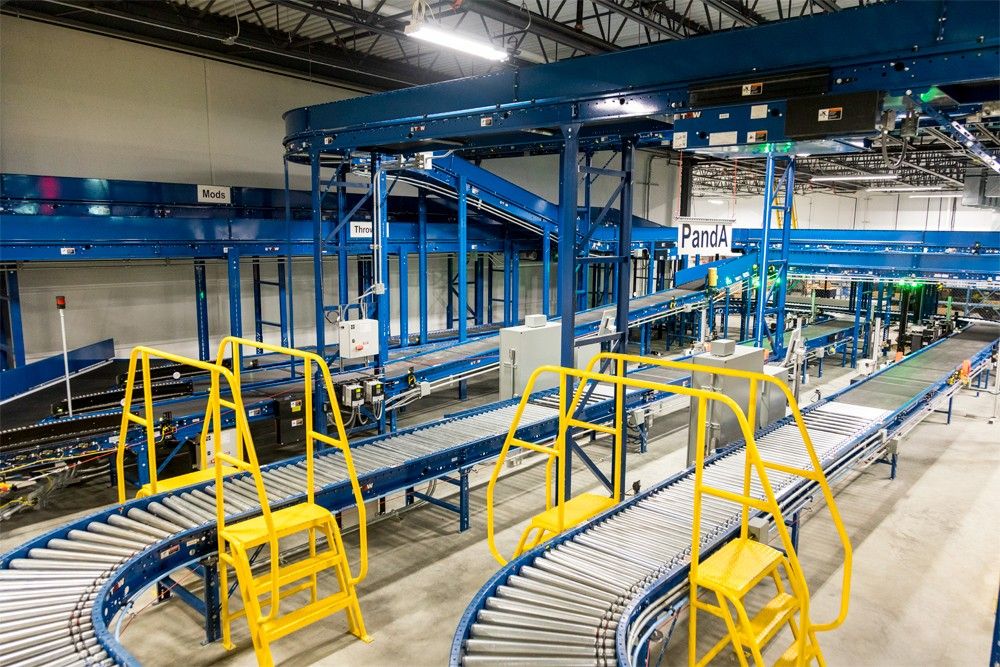
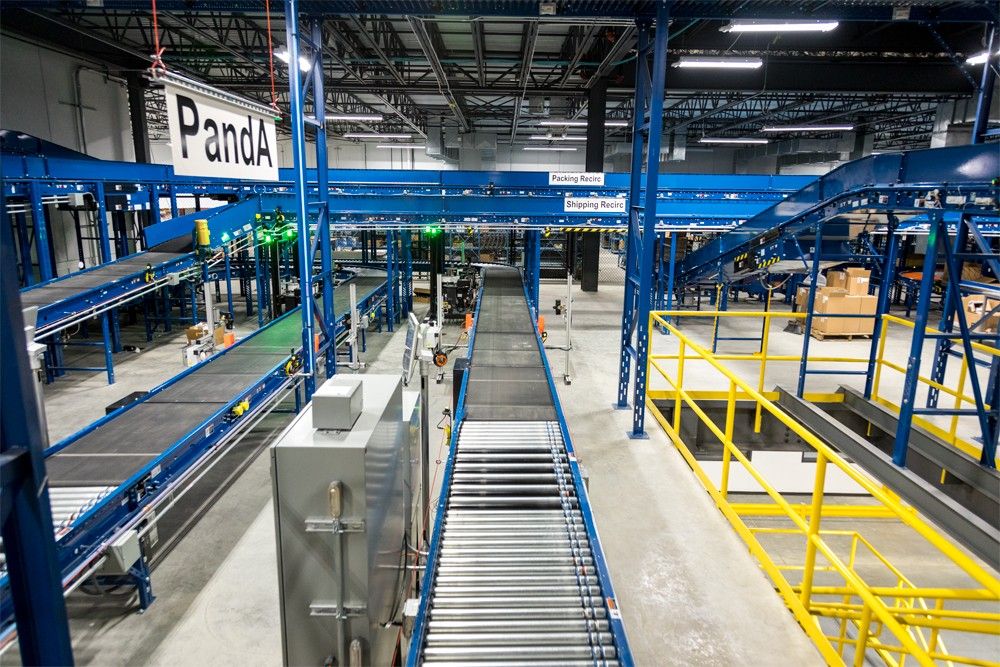
Conveyors do more of the work in the new DC, reducing worker travel time.
"Instead of having to take the one box from the shoe area to the clothes areas, we're able to pick all of the shoes of that type and route them to a put wall and do a secondary sort into the final order," says Matt Bommer, Fortna's business analyst manager, who worked on the Journeys project. "It makes your picking and packing more efficient."
Fortna's WES solution makes all of this possible. The WES monitors and controls the flow of orders through the DC, routing e-commerce orders in batches to one of several put-to-light walls, where employees sort them into predetermined slots, also referred to as "cubbies." Employees on the other side of the wall remove and package the final orders.
The DC design includes several put walls with a range of cubbies per wall. The system handles hundreds of orders per put wall at a time and can adjust depending on surge and peak needs. The layout of the system allows one loader to reach all of the cubbies on the put side of the wall, while a packer has access to half of the cubbies at a time on the other side. The packing process is longer and more time-consuming than loading the put wall, Davidson explains, so this process allows a single loader to support two packers, boosting productivity.
The new WES controls suggests shipping carton sizes for picked items and sends information back to Journeys' WMS so that a shipping label can be created and a packing slip printed.
Bommer emphasizes that the WES controls everything at the put wall—from determining which products are picked from totes and distributed to the wall, to suggesting shipping carton sizes for those items, and then sending all the appropriate messaging back to Journeys' warehouse management system (WMS) so that a shipping label can be created, a packing slip printed, and so on.
"[Companies] are moving toward WES capability because they are looking to optimize flow through the building," he says, emphasizing that the WES allows companies to do more "up front" planning so they can route orders more efficiently and balance labor requirements.
Journeys has increased picking productivity by 40 percent since implementing the WES and the accompanying automation changes. E-commerce throughput has increased by 200 percent, while traditional retail throughput has increased by 60 percent. With the new automation capabilities, Journeys cluster-picks its retail orders, which are routed separately from its e-commerce orders.
The WES implementation gives Journeys plenty of room to grow. As Davidson explains, "The system is expandable to meet future growth based on certain milestones reached in their consumer-direct business volumes."
The facility's IT manager, Nancy Harris, agrees.
"The Fortna WES solution gives us the necessary flexibility and scalability to evolve and grow right alongside our business," she says.
PLANNING FOR THE NEXT GROWTH WAVE
Moving forward, Fortna and Journeys will conduct yearly project reviews to make sure the retailer is meeting its growth targets. Fortna designed Journeys' automated system so that it can accommodate modular expansion based on how fast the company is growing. Davidson says Journeys is currently exceeding its growth projections and plans to expand those automation capabilities in two years.
"From a goal perspective, one of the biggest things [Journeys] wanted was flexibility combined with 100-percent ability to stay operational throughout the transition without any service disruption," Davidson says. "Most importantly, this is technology the company can grow with."
The promotional video below provides an inside look at the Journeys warehouse in action.
Most of the apparel sold in North America is manufactured in Asia, meaning the finished goods travel long distances to reach end markets, with all the associated greenhouse gas emissions. On top of that, apparel manufacturing itself requires a significant amount of energy, water, and raw materials like cotton. Overall, the production of apparel is responsible for about 2% of the world’s total greenhouse gas emissions, according to a report titled
Taking Stock of Progress Against the Roadmap to Net Zeroby the Apparel Impact Institute. Founded in 2017, the Apparel Impact Institute is an organization dedicated to identifying, funding, and then scaling solutions aimed at reducing the carbon emissions and other environmental impacts of the apparel and textile industries.
The author of this annual study is researcher and consultant Michael Sadowski. He wrote the first report in 2021 as well as the latest edition, which was released earlier this year. Sadowski, who is also executive director of the environmental nonprofit
The Circulate Initiative, recently joined DC Velocity Group Editorial Director David Maloney on an episode of the “Logistics Matters” podcast to discuss the key findings of the research, what companies are doing to reduce emissions, and the progress they’ve made since the first report was issued.
A: While companies in the apparel industry can set their own sustainability targets, we realized there was a need to give them a blueprint for actually reducing emissions. And so, we produced the first report back in 2021, where we laid out the emissions from the sector, based on the best estimates [we could make using] data from various sources. It gives companies and the sector a blueprint for what we collectively need to do to drive toward the ambitious reduction [target] of staying within a 1.5 degrees Celsius pathway. That was the first report, and then we committed to refresh the analysis on an annual basis. The second report was published last year, and the third report came out in May of this year.
Q: What were some of the key findings of your research?
A: We found that about half of the emissions in the sector come from Tier Two, which is essentially textile production. That includes the knitting, weaving, dyeing, and finishing of fabric, which together account for over half of the total emissions. That was a really important finding, and it allows us to focus our attention on the interventions that can drive those emissions down.
Raw material production accounts for another quarter of emissions. That includes cotton farming, extracting gas and oil from the ground to make synthetics, and things like that. So we now have a really keen understanding of the source of our industry’s emissions.
Q: Your report mentions that the apparel industry is responsible for about 2% of global emissions. Is that an accurate statistic?
A: That’s our best estimate of the total emissions [generated by] the apparel sector. Some other reports on the industry have apparel at up to 8% of global emissions. And there is a commonly misquoted number in the media that it’s 10%. From my perspective, I think the best estimate is somewhere under 2%.
We know that globally, humankind needs to reduce emissions by roughly half by 2030 and reach net zero by 2050 to hit international goals. [Reaching that target will require the involvement of] every facet of the global economy and every aspect of the apparel sector—transportation, material production, manufacturing, cotton farming. Through our work and that of others, I think the apparel sector understands what has to happen. We have highlighted examples of how companies are taking action to reduce emissions in the roadmap reports.
Q: What are some of those actions the industry can take to reduce emissions?
A: I think one of the positive developments since we wrote the first report is that we’re seeing companies really focus on the most impactful areas. We see companies diving deep on thermal energy, for example. With respect to Tier Two, we [focus] a lot of attention on things like ocean freight versus air. There’s a rule of thumb I’ve heard that indicates air freight is about 10 times the cost [of ocean] and also produces 10 times more greenhouse gas emissions.
There is money available to invest in sustainability efforts. It’s really exciting to see the funding that’s coming through for AI [artificial intelligence] and to see that individual companies, such as H&M and Lululemon, are investing in real solutions in their supply chains. I think a lot of concrete actions are being taken.
And yet we know that reducing emissions by half on an absolute basis by 2030 is a monumental undertaking. So I don’t want to be overly optimistic, because I think we have a lot of work to do. But I do think we’ve got some amazing progress happening.
Q: You mentioned several companies that are starting to address their emissions. Is that a result of their being more aware of the emissions they generate? Have you seen progress made since the first report came out in 2021?
A: Yes. When we published the first roadmap back in 2021, our statistics showed that only about 12 companies had met the criteria [for setting] science-based targets. In 2024, the number of apparel, textile, and footwear companies that have set targets or have commitments to set targets is close to 500. It’s an enormous increase. I think they see the urgency more than other sectors do.
We have companies that have been working at sustainability for quite a long time. I think the apparel sector has developed a keen understanding of the impacts of climate change. You can see the impacts of flooding, drought, heat, and other things happening in places like Bangladesh and Pakistan and India. If you’re a brand or a manufacturer and you have operations and supply chains in these places, I think you understand what the future will look like if we don’t significantly reduce emissions.
Q: There are different categories of emission levels, depending on the role within the supply chain. Scope 1 are “direct” emissions under the reporting company’s control. For apparel, this might be the production of raw materials or the manufacturing of the finished product. Scope 2 covers “indirect” emissions from purchased energy, such as electricity used in these processes. Scope 3 emissions are harder to track, as they include emissions from supply chain partners both upstream and downstream.
Now companies are finding there are legislative efforts around the world that could soon require them to track and report on all these emissions, including emissions produced by their partners’ supply chains. Does this mean that companies now need to be more aware of not only what greenhouse gas emissions they produce, but also what their partners produce?
A: That’s right. Just to put this into context, if you’re a brand like an Adidas or a Gap, you still have to consider the Scope 3 emissions. In particular, there are the so-called “purchased goods and services,” which refers to all of the embedded emissions in your products, from farming cotton to knitting yarn to making fabric. Those “purchased goods and services” generally account for well above 80% of the total emissions associated with a product. It’s by far the most significant portion of your emissions.
Leading companies have begun measuring and taking action on Scope 3 emissions because of regulatory developments in Europe and, to some extent now, in California. I do think this is just a further tailwind for the work that the industry is doing.
I also think it will definitely ratchet up the quality requirements of Scope 3 data, which is not yet where we’d all like it to be. Companies are working to improve that data, but I think the regulatory push will make the quality side increasingly important.
Q: Overall, do you think the work being done by the Apparel Impact Institute will help reduce greenhouse gas emissions within the industry?
A: When we started this back in 2020, we were at a place where companies were setting targets and knew their intended destination, but what they needed was a blueprint for how to get there. And so, the roadmap [provided] this blueprint and identified six key things that the sector needed to do—from using more sustainable materials to deploying renewable electricity in the supply chain.
Decarbonizing any sector, whether it’s transportation, chemicals, or automotive, requires investment. The Apparel Impact Institute is bringing collective investment, which is so critical. I’m really optimistic about what they’re doing. They have taken a data-driven, evidence-based approach, so they know where the emissions are and they know what the needed interventions are. And they’ve got the industry behind them in doing that.
The global air cargo market’s hot summer of double-digit demand growth continued in August with average spot rates showing their largest year-on-year jump with a 24% increase, according to the latest weekly analysis by Xeneta.
Xeneta cited two reasons to explain the increase. First, Global average air cargo spot rates reached $2.68 per kg in August due to continuing supply and demand imbalance. That came as August's global cargo supply grew at its slowest ratio in 2024 to-date at 2% year-on-year, while global cargo demand continued its double-digit growth, rising +11%.
The second reason for higher rates was an ocean-to-air shift in freight volumes due to Red Sea disruptions and e-commerce demand.
Those factors could soon be amplified as e-commerce shows continued strong growth approaching the hotly anticipated winter peak season. E-commerce and low-value goods exports from China in the first seven months of 2024 increased 30% year-on-year, including shipments to Europe and the US rising 38% and 30% growth respectively, Xeneta said.
“Typically, air cargo market performance in August tends to follow the July trend. But another month of double-digit demand growth and the strongest rate growths of the year means there was definitely no summer slack season in 2024,” Niall van de Wouw, Xeneta’s chief airfreight officer, said in a release.
“Rates we saw bottoming out in late July started picking up again in mid-August. This is too short a period to call a season. This has been a busy summer, and now we’re at the threshold of Q4, it will be interesting to see what will happen and if all the anticipation of a red-hot peak season materializes,” van de Wouw said.
The report cites data showing that there are approximately 1.7 million workers missing from the post-pandemic workforce and that 38% of small firms are unable to fill open positions. At the same time, the “skills gap” in the workforce is accelerating as automation and AI create significant shifts in how work is performed.
That information comes from the “2024 Labor Day Report” released by Littler’s Workplace Policy Institute (WPI), the firm’s government relations and public policy arm.
“We continue to see a labor shortage and an urgent need to upskill the current workforce to adapt to the new world of work,” said Michael Lotito, Littler shareholder and co-chair of WPI. “As corporate executives and business leaders look to the future, they are focused on realizing the many benefits of AI to streamline operations and guide strategic decision-making, while cultivating a talent pipeline that can support this growth.”
But while the need is clear, solutions may be complicated by public policy changes such as the upcoming U.S. general election and the proliferation of employment-related legislation at the state and local levels amid Congressional gridlock.
“We are heading into a contentious election that has already proven to be unpredictable and is poised to create even more uncertainty for employers, no matter the outcome,” Shannon Meade, WPI’s executive director, said in a release. “At the same time, the growing patchwork of state and local requirements across the U.S. is exacerbating compliance challenges for companies. That, coupled with looming changes following several Supreme Court decisions that have the potential to upend rulemaking, gives C-suite executives much to contend with in planning their workforce-related strategies.”
Stax Engineering, the venture-backed startup that provides smokestack emissions reduction services for maritime ships, will service all vessels from Toyota Motor North America Inc. visiting the Toyota Berth at the Port of Long Beach, according to a new five-year deal announced today.
Beginning in 2025 to coincide with new California Air Resources Board (CARB) standards, STAX will become the first and only emissions control provider to service roll-on/roll-off (ro-ros) vessels in the state of California, the company said.
Stax has rapidly grown since its launch in the first quarter of this year, supported in part by a $40 million funding round from investors, announced in July. It now holds exclusive service agreements at California ports including Los Angeles, Long Beach, Hueneme, Benicia, Richmond, and Oakland. The firm has also partnered with individual companies like NYK Line, Hyundai GLOVIS, Equilon Enterprises LLC d/b/a Shell Oil Products US (Shell), and now Toyota.
Stax says it offers an alternative to shore power with land- and barge-based, mobile emissions capture and control technology for shipping terminal and fleet operators without the need for retrofits.
In the case of this latest deal, the Toyota Long Beach Vehicle Distribution Center imports about 200,000 vehicles each year on ro-ro vessels. Stax will keep those ships green with its flexible exhaust capture system, which attaches to all vessel classes without modification to remove 99% of emitted particulate matter (PM) and 95% of emitted oxides of nitrogen (NOx). Over the lifetime of this new agreement with Toyota, Stax estimated the service will account for approximately 3,700 hours and more than 47 tons of emissions controlled.
“We set out to provide an emissions capture and control solution that was reliable, easily accessible, and cost-effective. As we begin to service Toyota, we’re confident that we can meet the needs of the full breadth of the maritime industry, furthering our impact on the local air quality, public health, and environment,” Mike Walker, CEO of Stax, said in a release. “Continuing to establish strong partnerships will help build momentum for and trust in our technology as we expand beyond the state of California.”
That result showed that driver wages across the industry continue to increase post-pandemic, despite a challenging freight market for motor carriers. The data comes from ATA’s “Driver Compensation Study,” which asked 120 fleets, more than 150,000 employee drivers, and 14,000 independent contractors about their wage and benefit information.
Drilling into specific categories, linehaul less-than-truckload (LTL) drivers earned a median annual amount of $94,525 in 2023, while local LTL drivers earned a median of $80,680. The median annual compensation for drivers at private carriers has risen 12% since 2021, reaching $95,114 in 2023. And leased-on independent contractors for truckload carriers were paid an annual median amount of $186,016 in 2023.
The results also showed how the demographics of the industry are changing, as carriers offered smaller referral and fewer sign-on bonuses for new drivers in 2023 compared to 2021 but more frequently offered tenure bonuses to their current drivers and with a greater median value.
"While our last study, conducted in 2021, illustrated how drivers benefitted from the strongest freight environment in a generation, this latest report shows professional drivers' earnings are still rising—even in a weaker freight economy," ATA Chief Economist Bob Costello said in a release. "By offering greater tenure bonuses to their current driver force, many fleets appear to be shifting their workforce priorities from recruitment to retention."