David Maloney has been a journalist for more than 35 years and is currently the group editorial director for DC Velocity and Supply Chain Quarterly magazines. In this role, he is responsible for the editorial content of both brands of Agile Business Media. Dave joined DC Velocity in April of 2004. Prior to that, he was a senior editor for Modern Materials Handling magazine. Dave also has extensive experience as a broadcast journalist. Before writing for supply chain publications, he was a journalist, television producer and director in Pittsburgh. Dave combines a background of reporting on logistics with his video production experience to bring new opportunities to DC Velocity readers, including web videos highlighting top distribution and logistics facilities, webcasts and other cross-media projects. He continues to live and work in the Pittsburgh area.
Speed is crucial in any athletic endeavor. Puma, the German sports brand, is well aware of this. Speed wins—not only on the field, but also in distribution.
For a time, however, Puma North America faced a speed challenge of its own. Years of steady retail growth coupled with surging e-commerce volume left it struggling to keep pace with order fulfillment demands.
A recent consolidation of its distribution operations and the addition of new software and related technology changed all that. With its mojo back, Puma is now running well ahead of the pack.
ALL UNDER ONE ROOF
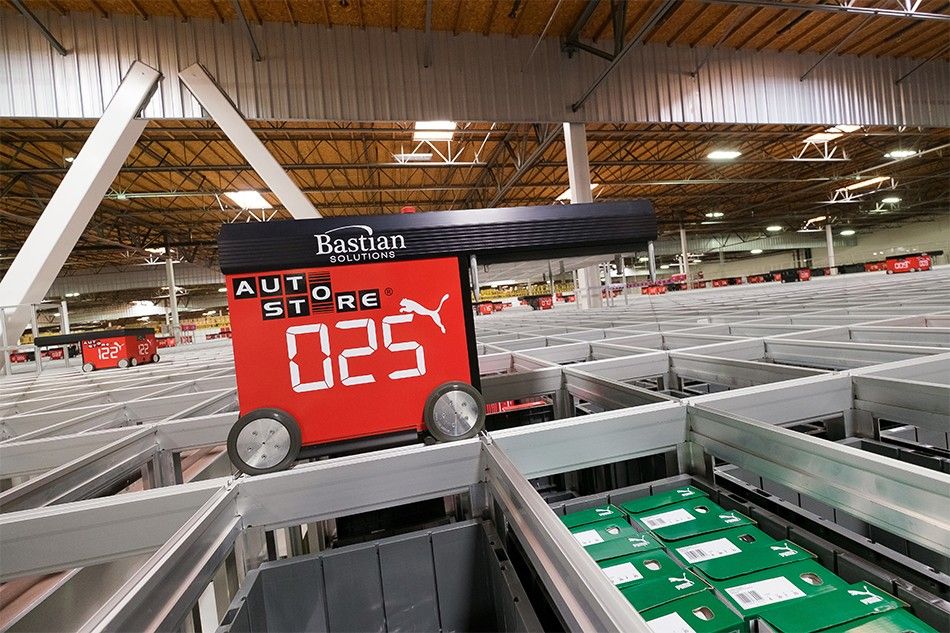
AutoStore provides high-density storage using stacked bins arrayed in a grid. Robots ride on rails along the tops of the stacks, retrieving bins as needed for delivery to goods-to-person fulfillment stations.
As a leading provider of footwear, sports apparel, and golf equipment through its Puma and Cobra Puma Golf brands, Puma records about $5 billion in annual sales, about $1.75 billion of which comes from the Americas. Up until a few years ago, it served customers in the U.S. from three distribution centers: one in Torrance, Calif., that distributed footwear, another in nearby Carson that handled apparel, and a contract facility in Ohio that filled e-commerce orders. We should also note that Puma distributes through retail and wholesale channels as well.
While this arrangement worked for a time, it also had some drawbacks. For instance, there were occasions when an e-commerce customer would receive three separate shipments for one order. The setup also required a lot of labor and overhead to staff three facilities.
Another issue was that, as a result of rising e-commerce volumes, the company was fast outgrowing the network's fulfillment capabilities. The crunch was especially pronounced during the December holiday season, when Puma does 20 percent of its annual e-com business.
"Our e-commerce channel was growing so fast that we wanted to take it in-house," says Nicole Barrasso, senior director, strategic supply chain initiatives. She notes that e-commerce is a very different animal from the company's other channels. "Instead of 10 orders of 1,000, it means distributing 1,000 orders of one," she says.
In 2016, the company decided to consolidate all of its distribution operations at the Torrance DC. As it happened, the tenant in the other half of the facility was not renewing its lease, which allowed Puma to take over the entire 670,000-square-foot building. Acquiring that space opened up all kinds of possibilities for Puma and the third party it contracted to run the facility—Brookvale International, a division of California Cartage Co. Among other things, Brookvale would be able to bring distribution for Puma's footwear, apparel, and accessories under one roof, while serving all three channels—e-commerce, retail, and wholesale—from a shared inventory.
To equip the building, Puma turned to systems integrator Bastian Solutions. Puma had worked with Bastian in the past and was confident the supplier would be able to provide solid solutions to fit its needs. Bastian actually proposed four automation designs, with Puma choosing one centered on the AutoStore automated storage and picking system.
SECURE STORAGE
The AutoStore technology hails from Norway but has had a number of successful installations in the U.S. It provides high-density storage using stacked bins arrayed in a grid. Robots ride on rails along the tops of the stacks, retrieving bins as needed for delivery to goods-to-person fulfillment stations.
Puma's AutoStore occupies only 50,000 square feet (115,000 square feet, if you include inbound and outbound conveyors). Despite that small footprint, the AutoStore system can hold 4 million products, including half a million shoes. Products are housed in 171,000 bins that are stacked 16 high, with 170 robots to service them.
Puma can fit all of its sports accessories, apparel, and golf accessories, as well as shoes for e-commerce orders, into the AutoStore, according to Barrasso. And the benefits don't stop there. "We have experienced labor savings, and it has changed our e-commerce throughput overnight," she reports.
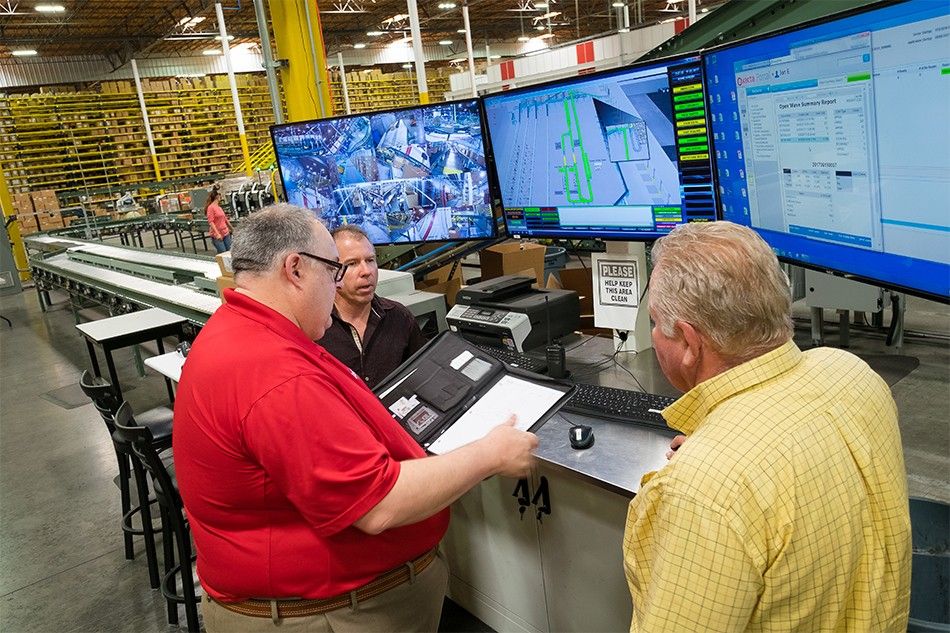
As orders are received, the warehouse management system (WMS) communicates with the warehouse control system (WCS). The WCS then determines whether they should be diverted to reserve storage or directly to the AutoStore system.
In order to realize the automated system's full potential, Puma also upgraded the facility's warehouse management system (WMS) at the time of the expansion. Puma and Bastian worked with software developer Manhattan Associates Inc. for the upgrade, which ties directly into Bastian's "exacta" brand warehouse control system (WCS), which coordinates the material handling systems.
Because of the facility's location in California, the AutoStore was engineered to meet strict seismic requirements. "If there is an earthquake, the best place to sit is inside the AutoStore. We put a lot into that planning," Barrasso says. "We had great partners working with Bastian and Manhattan for the systems. It all worked as planned, so now we are just trying to make it even better and faster."
THE GAME IS AFOOT
Operations in the facility begin in receiving, where cartons of inbound items are loaded onto conveyors and scanned. Based on those scans, the WCS determines whether they should be diverted to the left for the reserve storage area or right to the AutoStore system. Most of the shoes and larger items, as well as products not immediately needed for the AutoStore, are sent to reserve storage, where up to 1.5 million units are stored in racks.
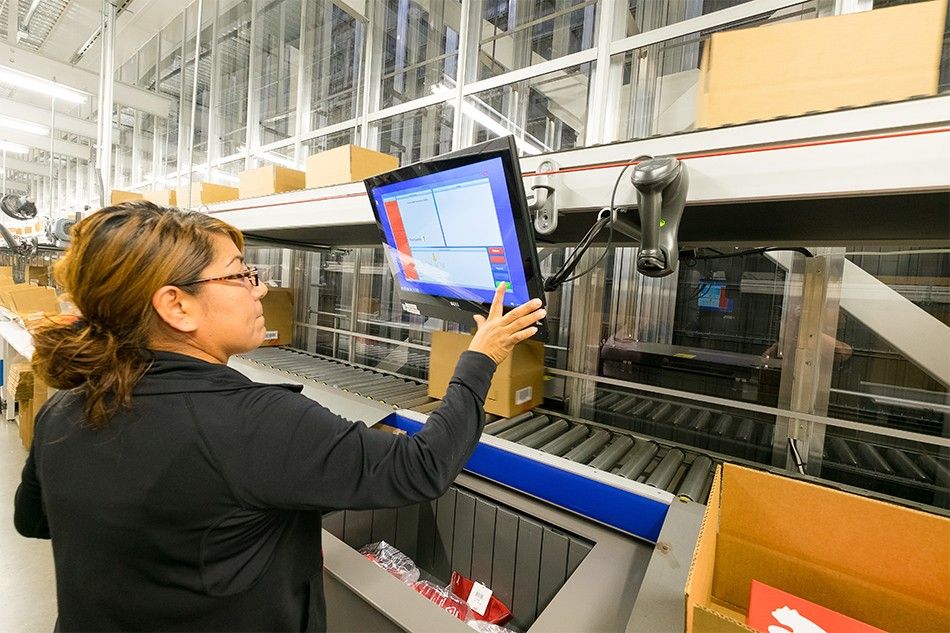
Whether they arrive directly from receiving or as replenishments from the reserve racks, products entering the AutoStore are assigned to one of six inbound stations for induction into the system. An associate opens the cartons and scans the items. The scan initiates the delivery of AutoStore bins to the station.
Most of the bins hold a single stock-keeping unit (SKU), though 20,000 of the bins have storage slots separated by dividers to accommodate multiple SKUs. A display screen provides directions to workers on which products go where in the container. Once a bin is complete, it is automatically returned to the AutoStore. In all, about 30,000 different SKUs reside in the system.
Picking stations are located in the middle of the AutoStore's gridwork to minimize the robots' travel time.
As orders arrive for the day's processing, the WMS sends them to the WCS that manages order fulfillment activities. The WCS batches the orders into waves to optimize the fulfillment process.
"One of the greatest gains we got was being able to send multiple waves throughout the day," Barrasso says. She adds that the AutoStore's ability to continuously reshuffle the bins within the stacks allows the system to prepare for picking future waves in addition to processing the current wave. For example, the system can work overnight to rearrange the bins' positions within the stacks to speed up retrieval operations the next morning. In addition, the software can build mini-waves throughout the day.
The system's robots gather bins holding products for the current wave for delivery to 16 picking stations. The stations are located in the middle of the AutoStore's gridwork to minimize the robots' travel time.
A single bin is presented at a station at a time to reduce the chances of a mis-pick. The design also assures the security of products in the AutoStore. "No one is getting anything out of there unless they are picking," Barrasso notes.
A display screen at the station shows the worker a picture of the item (or items) to be selected, along with the quantity to pick. For bins with multiple storage slots, a light above the station illuminates the bin's interior and a graphic on the screen indicates which slot contains the required product. As a result of all these failsafe features, picking accuracy is so high that the facility no longer bothers to send orders for quality checks.
Four totes or cartons representing orders are staged adjacent to the source bin for gathering the needed items. Six-slotted totes are mainly used for e-commerce orders, while cartons are used for retail and wholesale orders. The cartons arrive from two automated carton erectors that build boxes in six primary sizes.
Lights and quantity displays at each tote or carton indicate how many items should go into each order container. The picking process then continues until the container is full or the order is complete, at which time it is pushed off onto a take-away conveyor.
Retail store orders exit the system via a Bastian ZiPline conveyor that transports many of the cartons to value-added stations. Here, workers perform various services to make the products retail-friendly, such as ticketing or refolding garments for display. The orders next join up with the cartons that bypassed the stations to pass though auto-taping and labeling machines before heading to shipping. There, the cartons are floor-loaded onto outbound trucks.
E-commerce orders are sent to processing stations where workers remove the items, scan each one, and place them on a belt for transport to an auto-bagging system. The bagging systems can process 360 bags per hour per station. The bags are then conveyed to shipping, where pop-up wheels within the conveyors divert them to one of five lanes based on carrier assignment.
HITTING THE GROUND RUNNING
As for how the new setup has been working out, Puma executives have high praise for the automated equipment. The AutoStore system has helped Puma achieve double-digit savings on staffing costs, which is important in Torrance's tight job market, according to Barrasso. "The supply of workers just is not there to meet the demand. But the AutoStore is simple to use, and it is very easy to train new people on it. We can get them working in minutes so that they can hit the ground running," she says.
Barrasso adds that being in one building also makes it easier to move associates wherever they're needed within any of the operations. Typically, the building runs two shifts, but it can ramp up to three during peak periods.
Speed and productivity are also on the rise because the AutoStore can process 200 lines per operator per hour. During the recent holiday crunch, 97 percent of e-commerce orders shipped within 24 hours, Barrasso reports.
"We can process 24,000 e-commerce orders a day now," she says. "Before, we could only handle about 6,000."
Watch a video about the system and see it in action below.
Most of the apparel sold in North America is manufactured in Asia, meaning the finished goods travel long distances to reach end markets, with all the associated greenhouse gas emissions. On top of that, apparel manufacturing itself requires a significant amount of energy, water, and raw materials like cotton. Overall, the production of apparel is responsible for about 2% of the world’s total greenhouse gas emissions, according to a report titled
Taking Stock of Progress Against the Roadmap to Net Zeroby the Apparel Impact Institute. Founded in 2017, the Apparel Impact Institute is an organization dedicated to identifying, funding, and then scaling solutions aimed at reducing the carbon emissions and other environmental impacts of the apparel and textile industries.
The author of this annual study is researcher and consultant Michael Sadowski. He wrote the first report in 2021 as well as the latest edition, which was released earlier this year. Sadowski, who is also executive director of the environmental nonprofit
The Circulate Initiative, recently joined DC Velocity Group Editorial Director David Maloney on an episode of the “Logistics Matters” podcast to discuss the key findings of the research, what companies are doing to reduce emissions, and the progress they’ve made since the first report was issued.
A: While companies in the apparel industry can set their own sustainability targets, we realized there was a need to give them a blueprint for actually reducing emissions. And so, we produced the first report back in 2021, where we laid out the emissions from the sector, based on the best estimates [we could make using] data from various sources. It gives companies and the sector a blueprint for what we collectively need to do to drive toward the ambitious reduction [target] of staying within a 1.5 degrees Celsius pathway. That was the first report, and then we committed to refresh the analysis on an annual basis. The second report was published last year, and the third report came out in May of this year.
Q: What were some of the key findings of your research?
A: We found that about half of the emissions in the sector come from Tier Two, which is essentially textile production. That includes the knitting, weaving, dyeing, and finishing of fabric, which together account for over half of the total emissions. That was a really important finding, and it allows us to focus our attention on the interventions that can drive those emissions down.
Raw material production accounts for another quarter of emissions. That includes cotton farming, extracting gas and oil from the ground to make synthetics, and things like that. So we now have a really keen understanding of the source of our industry’s emissions.
Q: Your report mentions that the apparel industry is responsible for about 2% of global emissions. Is that an accurate statistic?
A: That’s our best estimate of the total emissions [generated by] the apparel sector. Some other reports on the industry have apparel at up to 8% of global emissions. And there is a commonly misquoted number in the media that it’s 10%. From my perspective, I think the best estimate is somewhere under 2%.
We know that globally, humankind needs to reduce emissions by roughly half by 2030 and reach net zero by 2050 to hit international goals. [Reaching that target will require the involvement of] every facet of the global economy and every aspect of the apparel sector—transportation, material production, manufacturing, cotton farming. Through our work and that of others, I think the apparel sector understands what has to happen. We have highlighted examples of how companies are taking action to reduce emissions in the roadmap reports.
Q: What are some of those actions the industry can take to reduce emissions?
A: I think one of the positive developments since we wrote the first report is that we’re seeing companies really focus on the most impactful areas. We see companies diving deep on thermal energy, for example. With respect to Tier Two, we [focus] a lot of attention on things like ocean freight versus air. There’s a rule of thumb I’ve heard that indicates air freight is about 10 times the cost [of ocean] and also produces 10 times more greenhouse gas emissions.
There is money available to invest in sustainability efforts. It’s really exciting to see the funding that’s coming through for AI [artificial intelligence] and to see that individual companies, such as H&M and Lululemon, are investing in real solutions in their supply chains. I think a lot of concrete actions are being taken.
And yet we know that reducing emissions by half on an absolute basis by 2030 is a monumental undertaking. So I don’t want to be overly optimistic, because I think we have a lot of work to do. But I do think we’ve got some amazing progress happening.
Q: You mentioned several companies that are starting to address their emissions. Is that a result of their being more aware of the emissions they generate? Have you seen progress made since the first report came out in 2021?
A: Yes. When we published the first roadmap back in 2021, our statistics showed that only about 12 companies had met the criteria [for setting] science-based targets. In 2024, the number of apparel, textile, and footwear companies that have set targets or have commitments to set targets is close to 500. It’s an enormous increase. I think they see the urgency more than other sectors do.
We have companies that have been working at sustainability for quite a long time. I think the apparel sector has developed a keen understanding of the impacts of climate change. You can see the impacts of flooding, drought, heat, and other things happening in places like Bangladesh and Pakistan and India. If you’re a brand or a manufacturer and you have operations and supply chains in these places, I think you understand what the future will look like if we don’t significantly reduce emissions.
Q: There are different categories of emission levels, depending on the role within the supply chain. Scope 1 are “direct” emissions under the reporting company’s control. For apparel, this might be the production of raw materials or the manufacturing of the finished product. Scope 2 covers “indirect” emissions from purchased energy, such as electricity used in these processes. Scope 3 emissions are harder to track, as they include emissions from supply chain partners both upstream and downstream.
Now companies are finding there are legislative efforts around the world that could soon require them to track and report on all these emissions, including emissions produced by their partners’ supply chains. Does this mean that companies now need to be more aware of not only what greenhouse gas emissions they produce, but also what their partners produce?
A: That’s right. Just to put this into context, if you’re a brand like an Adidas or a Gap, you still have to consider the Scope 3 emissions. In particular, there are the so-called “purchased goods and services,” which refers to all of the embedded emissions in your products, from farming cotton to knitting yarn to making fabric. Those “purchased goods and services” generally account for well above 80% of the total emissions associated with a product. It’s by far the most significant portion of your emissions.
Leading companies have begun measuring and taking action on Scope 3 emissions because of regulatory developments in Europe and, to some extent now, in California. I do think this is just a further tailwind for the work that the industry is doing.
I also think it will definitely ratchet up the quality requirements of Scope 3 data, which is not yet where we’d all like it to be. Companies are working to improve that data, but I think the regulatory push will make the quality side increasingly important.
Q: Overall, do you think the work being done by the Apparel Impact Institute will help reduce greenhouse gas emissions within the industry?
A: When we started this back in 2020, we were at a place where companies were setting targets and knew their intended destination, but what they needed was a blueprint for how to get there. And so, the roadmap [provided] this blueprint and identified six key things that the sector needed to do—from using more sustainable materials to deploying renewable electricity in the supply chain.
Decarbonizing any sector, whether it’s transportation, chemicals, or automotive, requires investment. The Apparel Impact Institute is bringing collective investment, which is so critical. I’m really optimistic about what they’re doing. They have taken a data-driven, evidence-based approach, so they know where the emissions are and they know what the needed interventions are. And they’ve got the industry behind them in doing that.
The global air cargo market’s hot summer of double-digit demand growth continued in August with average spot rates showing their largest year-on-year jump with a 24% increase, according to the latest weekly analysis by Xeneta.
Xeneta cited two reasons to explain the increase. First, Global average air cargo spot rates reached $2.68 per kg in August due to continuing supply and demand imbalance. That came as August's global cargo supply grew at its slowest ratio in 2024 to-date at 2% year-on-year, while global cargo demand continued its double-digit growth, rising +11%.
The second reason for higher rates was an ocean-to-air shift in freight volumes due to Red Sea disruptions and e-commerce demand.
Those factors could soon be amplified as e-commerce shows continued strong growth approaching the hotly anticipated winter peak season. E-commerce and low-value goods exports from China in the first seven months of 2024 increased 30% year-on-year, including shipments to Europe and the US rising 38% and 30% growth respectively, Xeneta said.
“Typically, air cargo market performance in August tends to follow the July trend. But another month of double-digit demand growth and the strongest rate growths of the year means there was definitely no summer slack season in 2024,” Niall van de Wouw, Xeneta’s chief airfreight officer, said in a release.
“Rates we saw bottoming out in late July started picking up again in mid-August. This is too short a period to call a season. This has been a busy summer, and now we’re at the threshold of Q4, it will be interesting to see what will happen and if all the anticipation of a red-hot peak season materializes,” van de Wouw said.
The report cites data showing that there are approximately 1.7 million workers missing from the post-pandemic workforce and that 38% of small firms are unable to fill open positions. At the same time, the “skills gap” in the workforce is accelerating as automation and AI create significant shifts in how work is performed.
That information comes from the “2024 Labor Day Report” released by Littler’s Workplace Policy Institute (WPI), the firm’s government relations and public policy arm.
“We continue to see a labor shortage and an urgent need to upskill the current workforce to adapt to the new world of work,” said Michael Lotito, Littler shareholder and co-chair of WPI. “As corporate executives and business leaders look to the future, they are focused on realizing the many benefits of AI to streamline operations and guide strategic decision-making, while cultivating a talent pipeline that can support this growth.”
But while the need is clear, solutions may be complicated by public policy changes such as the upcoming U.S. general election and the proliferation of employment-related legislation at the state and local levels amid Congressional gridlock.
“We are heading into a contentious election that has already proven to be unpredictable and is poised to create even more uncertainty for employers, no matter the outcome,” Shannon Meade, WPI’s executive director, said in a release. “At the same time, the growing patchwork of state and local requirements across the U.S. is exacerbating compliance challenges for companies. That, coupled with looming changes following several Supreme Court decisions that have the potential to upend rulemaking, gives C-suite executives much to contend with in planning their workforce-related strategies.”
Stax Engineering, the venture-backed startup that provides smokestack emissions reduction services for maritime ships, will service all vessels from Toyota Motor North America Inc. visiting the Toyota Berth at the Port of Long Beach, according to a new five-year deal announced today.
Beginning in 2025 to coincide with new California Air Resources Board (CARB) standards, STAX will become the first and only emissions control provider to service roll-on/roll-off (ro-ros) vessels in the state of California, the company said.
Stax has rapidly grown since its launch in the first quarter of this year, supported in part by a $40 million funding round from investors, announced in July. It now holds exclusive service agreements at California ports including Los Angeles, Long Beach, Hueneme, Benicia, Richmond, and Oakland. The firm has also partnered with individual companies like NYK Line, Hyundai GLOVIS, Equilon Enterprises LLC d/b/a Shell Oil Products US (Shell), and now Toyota.
Stax says it offers an alternative to shore power with land- and barge-based, mobile emissions capture and control technology for shipping terminal and fleet operators without the need for retrofits.
In the case of this latest deal, the Toyota Long Beach Vehicle Distribution Center imports about 200,000 vehicles each year on ro-ro vessels. Stax will keep those ships green with its flexible exhaust capture system, which attaches to all vessel classes without modification to remove 99% of emitted particulate matter (PM) and 95% of emitted oxides of nitrogen (NOx). Over the lifetime of this new agreement with Toyota, Stax estimated the service will account for approximately 3,700 hours and more than 47 tons of emissions controlled.
“We set out to provide an emissions capture and control solution that was reliable, easily accessible, and cost-effective. As we begin to service Toyota, we’re confident that we can meet the needs of the full breadth of the maritime industry, furthering our impact on the local air quality, public health, and environment,” Mike Walker, CEO of Stax, said in a release. “Continuing to establish strong partnerships will help build momentum for and trust in our technology as we expand beyond the state of California.”
That result showed that driver wages across the industry continue to increase post-pandemic, despite a challenging freight market for motor carriers. The data comes from ATA’s “Driver Compensation Study,” which asked 120 fleets, more than 150,000 employee drivers, and 14,000 independent contractors about their wage and benefit information.
Drilling into specific categories, linehaul less-than-truckload (LTL) drivers earned a median annual amount of $94,525 in 2023, while local LTL drivers earned a median of $80,680. The median annual compensation for drivers at private carriers has risen 12% since 2021, reaching $95,114 in 2023. And leased-on independent contractors for truckload carriers were paid an annual median amount of $186,016 in 2023.
The results also showed how the demographics of the industry are changing, as carriers offered smaller referral and fewer sign-on bonuses for new drivers in 2023 compared to 2021 but more frequently offered tenure bonuses to their current drivers and with a greater median value.
"While our last study, conducted in 2021, illustrated how drivers benefitted from the strongest freight environment in a generation, this latest report shows professional drivers' earnings are still rising—even in a weaker freight economy," ATA Chief Economist Bob Costello said in a release. "By offering greater tenure bonuses to their current driver force, many fleets appear to be shifting their workforce priorities from recruitment to retention."